What is the purpose of a thread dump?
A thread dump will log what the current process' threads are working on at the time of the dump. If your application is hung or behaving improperly, it will allow you to diagnose the issue.
How do I do a thread dump?
To execute a thread dump, do a "kill -3" on the pid. The information will get dumped to the native_stdout.log file just like the garbage collection data. It's good to to several heap dumps over a couple of minutes. The more data you can collect, the easier it will be to diagnose. The thread data in the native_stdout.log will look something like this:
"WebContainer : 2" daemon prio=10 tid=0x01def5e8 nid=0xc7 runnable [0x879fe000..0x879ff8f0]
at java.util.regex.Pattern$BnM.match(Pattern.java:5447)
at java.util.regex.Matcher.search(Matcher.java:1092)
at java.util.regex.Matcher.find(Matcher.java:528)
"Thread-58" daemon prio=10 tid=0x0041bd28 nid=0x93 waiting on condition [0x880ff000..0x880ffaf0]
at java.lang.Thread.sleep(Native Method)
at org.apache.commons.pool.impl.GenericObjectPool$Evictor.run(GenericObjectPool.java:1080)
at java.lang.Thread.run(Thread.java:595)
"Thread-56" daemon prio=10 tid=0x03dbfcc0 nid=0x91 waiting on condition [0x87cff000..0x87cff9f0]
at java.lang.Thread.sleep(Native Method)
at org.apache.commons.pool.impl.GenericObjectPool$Evictor.run(GenericObjectPool.java:1080)
at java.lang.Thread.run(Thread.java:595)
Since your process can contain hundreds of threads, looking at the result can be a mess. In walks "Thread Analyzer" ...
IBM's Thread Analyzer
Thread Analyzer is another add-on just like the memory visualizer which will organize and graphically display the thread information. To see how to install it, go to Installing IBM Support Assistant and performance tools.
Once installed ...
Open Thread Analyzer

Click "Analyze Problem"

Next, select the Tools tab, highlight the Thread Analyzer Tool and click Launch

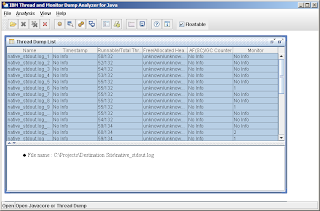
If you did multiple thread dumps, you will see several dumps to chose from. The most interesting ones are the ones where "Monitor" is something other than "No Info."
To see what the application was doing over time, go to: "Analysis" > "Compare Threads"

Here you can see that objects in wait like "DefaultQuartzScheduler_Worker-4" will sit waiting for an event to occur, execute then go back to waiting. You'll understand what the icons mean when we take a look at ...
Diagnosing an issue
Let's go back to the "Thread Dump List" and select a thread dump with a monitor other than "No Info" then click the first sprocket after the red X. You'll see something like:

On the right, you can see a break down of the icons we saw in the previous image. If a application is healthy, you'll normally see items in Object.wait, "Waiting on condition" and Runnable. If you at some of the threads with a "Waiting on Condition," you will most likely see things are either sleeping (thread.sleep), waiting (object.wait) or parking a lock to a non-busy state (Unsafe.park). I'm not sure why they don't get categorized into any of the other states.
I've yet to run into an example where the application was deadlocked or blocked, most of the issues I've seen have been like the one above where the app was caught up waiting on a monitor like the one above.
To see what the monitors are waiting on, highlight on of the Waiting stated on the left:

Here you can see it is being blocked by container 14. If we go look at 14:

You can see that 14 is blocking all the monitors and is stuck trying to read an item from a socket. As a performance tester, I can't take you to the next step of looking at the Java code to figure out what is wrong since it is a slightly gray box to me. However, if you present development with this information, it should make it easier for them to diagnose the issue.
As a side note, we could have also gotten to this point a little quicker by going to "Analysis" > "Monitor Detail":

Things of note
Myself as well as others have been unable to get the output report function of the tool which has to be done from the command line to work (see the help pull down in the tool). To give development a report, we usually copy and paste the Thread Summary into Word or take snapshots of notable items. If anyone figures this out, let me know. :)
There is another way to do heap dumps using jmap, but I've yet to try this out and heard it might work so good with jvms prior to 1.6.
Reference Links
IBM's site for Thread and Monitor Dump Analyzer for Java
PDF document on Thread Analyzer


