Saturday, October 4, 2008

Using SQL Server 2008 Express with LoadRunner Analysis

After trying several methods to avoid having LoadRunner's Analysis run out of memory with large files, which I will share in another post, I finally broke down and decided to install SQL Server. I saw a post on the internet that said not to use the SQL version 7 that came with the LoadRunner CD for version 7.8 and use MSDE 2000. That was obviously a very old article. :) I found other articles in which people failed to get LoasRunner to work with the latest SQL server version with no solution. Hopefully, this article helps resolve some of the issues people ran into. I, for one, wouldn't have figured out some of the obstacles without the help of a SQL guru. For the installation I used the latest LoadRunner 9.1 and SQL Server Express 2008.

Why should you use SQL Server?


From HP's help:
"If your Analysis result data exceeds two gigabytes, it is recommended that you store it on an SQL server or MSDE machine."

Installing SQL Server


Before you install SQL Server Express, you must first install the following:


Once installed, you should install SQL Server 2008 Express with Advanced Services. This comes with Management Studio which we will make use of.

When installing SQL Server make sure to install the two items highlighted in red:


Once installed to see if your installation is working, open up a command window and type the following (assuming you names your instance SQLEXPRESS):

C:\Documents and Settings\blah>sqlcmd -S (local)\SQLEXPRESS
1>

If you see the 1>, this means that your instance is working.

Configuring Analysis


Go into Analysis and go to Tools > Options > Database
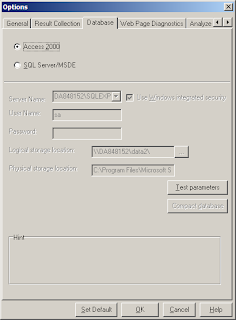


  • Select "SQL Server/MSDE".
  • For a server name, enter: [machine name]\[DB instance name]. (This isn't fully detailed in the HP help. It might be obvious to those who have installed SQL Server before, but it took me awhile to figure this out. You instance name will most likely be SQLEXPRESS. I appended a 2 when installing since I had a previous version of SQL installed which had taken that name.)
  • Select "Use Windows Integrated Security"
  • Click "Test Parameters," you should be able to see the following:


Hopefully, "Connection parameters" now works. We'll now tackle the "Shared server directory exists on server.", "Write permissions on shared server directory." and the "Synchronizing shared and physical server directories."

Whether the above works or not, go to the Windows Start button > Programs > Microsoft SQL Server 2008 > SQL Server Management Studio. You'll be presented with a screen which should look like:


If your Server name in the config didn't work above and doesn't match the one shown when you see the screen above, try using that one. If it did work, hit connect. Expand out the databases and highlight master.


Right-click and go to properties. Select files and copy the path name:


Go to the path in Explorer and share the Data directory. Do this by right-clicking on the folder and going to properties then Sharing. Input a name, then click Permissions.


In permissions, give everyone full access. I do this just in case. I hate nitpicking with permissions to things.


Your directory should have a little hand on it now:


Double check to see if it is shared by going to \\[machine name]\[share name]


Go back to Analysis and input the shared directory we just set up for "Logical Storage Location" along with the original directory for the physical storage location. Test the parameters again.


If you get an error on "Synchronizing shared and physical server directories." . Right-click on "My Computer" and select manage. under System Tools > Event Viewer > Application.


Look for any MSSQL messages. If you see the following:


This issue is described on Microsoft's site. Go back to Management Studio, click "New Query" and enter in the following:

-- To allow advanced options to be changed.
EXEC sp_configure 'show advanced options', 1
GO
-- To update the currently configured value for advanced options.
RECONFIGURE
GO
-- To enable the feature.
EXEC sp_configure 'xp_cmdshell', 1
GO
-- To update the currently configured value for this feature.
RECONFIGURE
GO


Hit the "! Execute" button.

Hopefully, this fixes the issue and you are able to save the Analysis configuration.

Opening a file


When opening a file, you may run into an issue where after opening results half way through, it hangs.

Check the Event Viewer again:

If you see the following:
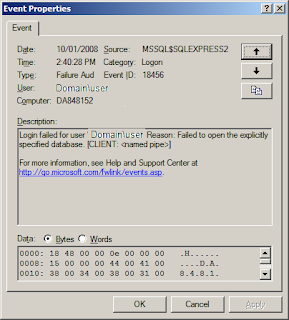


Create a new query in Management Studio with the following (changing 'user' to your login) and hit the "! Execute" button.:

EXEC sp_grantlogin 'Domain\user'

Then change it to the following (changing 'user' to your login) and hit the "! Execute" button.:

EXEC sp_grantdbaccess 'Domain\user', user

Hopefully this allows you to open up the file now. This will now allow Analysis to be a bit more stable.

However, it still won't totally solve Analysis's out of memory issues if you set the granularity to really low (1 second) for a long run.:


Deleting the results


When Analysis closes, it will delete the table from the database. If not, you can delete the table from the management studio by right-clicking on the table and selecting Delete. I do not recommend deleting the physical file from Explorer directly.

Saturday, September 20, 2008

Analyzing Java Thread Dumps with Thread Analyzer

What is the purpose of a thread dump?


A thread dump will log what the current process' threads are working on at the time of the dump. If your application is hung or behaving improperly, it will allow you to diagnose the issue.

How do I do a thread dump?


To execute a thread dump, do a "kill -3" on the pid. The information will get dumped to the native_stdout.log file just like the garbage collection data. It's good to to several heap dumps over a couple of minutes. The more data you can collect, the easier it will be to diagnose. The thread data in the native_stdout.log will look something like this:

"WebContainer : 2" daemon prio=10 tid=0x01def5e8 nid=0xc7 runnable [0x879fe000..0x879ff8f0]
at java.util.regex.Pattern$BnM.match(Pattern.java:5447)
at java.util.regex.Matcher.search(Matcher.java:1092)
at java.util.regex.Matcher.find(Matcher.java:528)
"Thread-58" daemon prio=10 tid=0x0041bd28 nid=0x93 waiting on condition [0x880ff000..0x880ffaf0]
at java.lang.Thread.sleep(Native Method)
at org.apache.commons.pool.impl.GenericObjectPool$Evictor.run(GenericObjectPool.java:1080)
at java.lang.Thread.run(Thread.java:595)
"Thread-56" daemon prio=10 tid=0x03dbfcc0 nid=0x91 waiting on condition [0x87cff000..0x87cff9f0]
at java.lang.Thread.sleep(Native Method)
at org.apache.commons.pool.impl.GenericObjectPool$Evictor.run(GenericObjectPool.java:1080)
at java.lang.Thread.run(Thread.java:595)


Since your process can contain hundreds of threads, looking at the result can be a mess. In walks "Thread Analyzer" ...

IBM's Thread Analyzer


Thread Analyzer is another add-on just like the memory visualizer which will organize and graphically display the thread information. To see how to install it, go to Installing IBM Support Assistant and performance tools.

Once installed ...

Open Thread Analyzer


Click "Analyze Problem"


Next, select the Tools tab, highlight the Thread Analyzer Tool and click Launch


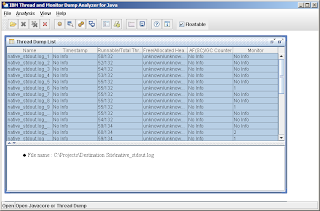
If you did multiple thread dumps, you will see several dumps to chose from. The most interesting ones are the ones where "Monitor" is something other than "No Info."

To see what the application was doing over time, go to: "Analysis" > "Compare Threads"


Here you can see that objects in wait like "DefaultQuartzScheduler_Worker-4" will sit waiting for an event to occur, execute then go back to waiting. You'll understand what the icons mean when we take a look at ...

Diagnosing an issue


Let's go back to the "Thread Dump List" and select a thread dump with a monitor other than "No Info" then click the first sprocket after the red X. You'll see something like:


On the right, you can see a break down of the icons we saw in the previous image. If a application is healthy, you'll normally see items in Object.wait, "Waiting on condition" and Runnable. If you at some of the threads with a "Waiting on Condition," you will most likely see things are either sleeping (thread.sleep), waiting (object.wait) or parking a lock to a non-busy state (Unsafe.park). I'm not sure why they don't get categorized into any of the other states.

I've yet to run into an example where the application was deadlocked or blocked, most of the issues I've seen have been like the one above where the app was caught up waiting on a monitor like the one above.

To see what the monitors are waiting on, highlight on of the Waiting stated on the left:


Here you can see it is being blocked by container 14. If we go look at 14:


You can see that 14 is blocking all the monitors and is stuck trying to read an item from a socket. As a performance tester, I can't take you to the next step of looking at the Java code to figure out what is wrong since it is a slightly gray box to me. However, if you present development with this information, it should make it easier for them to diagnose the issue.

As a side note, we could have also gotten to this point a little quicker by going to "Analysis" > "Monitor Detail":


Things of note


Myself as well as others have been unable to get the output report function of the tool which has to be done from the command line to work (see the help pull down in the tool). To give development a report, we usually copy and paste the Thread Summary into Word or take snapshots of notable items. If anyone figures this out, let me know. :)

There is another way to do heap dumps using jmap, but I've yet to try this out and heard it might work so good with jvms prior to 1.6.

Reference Links


IBM's site for Thread and Monitor Dump Analyzer for Java

PDF document on Thread Analyzer

Tuesday, September 16, 2008

Graphing Java Garbage Collection part 2: Making and analyzing graphs

Graphing Garbage Collection part 1 - using IBM's Memory Visualizer

What to look for


There are a few basic things to look for in the GC data.:
1)Does the graph look weird? Your memory should look like our first graph below: moving up and down as GC takes place. The moving of the total heap is a new thing with WebSphere 6.1.
2)Durations should never be more than 2.5 seconds. If they are, you should look at selecting a different type of GC or adding more threads to the current GC.
3)After heap collection should not trend up. With the latest version of the tool (as of last week), they have added a "Used Heap (after global collection)" option under "VGC Heap Data" to make this more clear.
4)Frequency of Full GCs and tuning. These are the big drops in the before and after heap. Since they take the longest time to happen, they should not happen several times a minute. Also if you are running a 24 hour longevity, you should have several GCs occur, otherwise the heap size it too high. Below you will also see other indications.

Standard Graphs


When analyzing Garbage Collection, there are two main graphs I like to do. The overall heap and duration.

Once you've opened up your GC file. Go under "VGC Heap Data" and select: "Heap size" and both "Used heap" options:


For the duration graph, clear out the selections and select "Pause times" under "VGC Pause Data":


More detailed graphs


The standard graphs are pretty good for identifying basic issues but the real power of the tool is the ability to show all three types of memory.
Overall:


Nursery or Young (I've kept the total heap in the graph so the scales are comparable):


Tenured (I've kept the total heap in the graph so the scales are comparable):


Permanent(I've kept the total heap in the graph so the scales are comparable):


From the graphs, you can see there is no leak happening but it still looks kind of strange. This is due to the compaction going on in the JVM. It is actually tuning itself with WebSphere 6.1. If you look at the graphs, you can see that permanent memory never grows but its total size was set many times above what its actual usage was. This could easily be tuned to use less. The tenured is also set much higher and could also be trimmed.

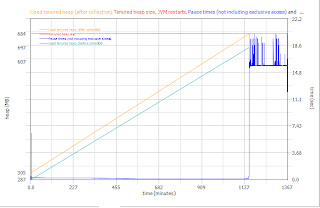
Now that you've seen some graphs with no or minor issue, we'll see what a bad one looks like. Here you can see the Tenured heap rise until it hits its max after several hours, then you can see the durations jump up to over 18 seconds! If you look at the logs, you should also see an Out Of Memory message.


Reports


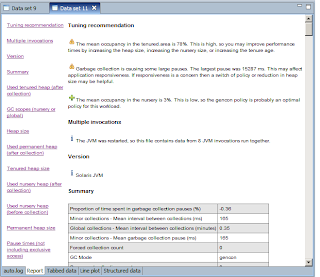
Another nice thing about this tool is the reports and analysis that is does. If you go to the report tab, you can see a report of all the options you have selected from "VGC Pause Data", "VGC Data", "VGC Heap Data." This is a good report to hand out since it is east to generate, but doesn't show the overlapping of any of the graphs like we did above. So if you are trying to illustrate a point, I would output the images from above by right clicking the graph and saving them as an image. To output the report, right click on it and select save. This will be saved as an HTML files with images. Make sure to put it in a new folder or the files will clutter which ever folder you pick.


Tips


* Clear the nativestdout files before running your test or you will need to adjust the time scale
* To zoom in, time in times on the right (do not try to zoom since it will most likely show a blank graph and might freeze up)
* The time won't be clock time, it will be based on the time the server started. You can only adjust the scale such as ms, seconds or days.
* If you see a funny graph with crisscross lines like the following:


This is most likely due to the app being recycled. Turn on "JVM Restarts" under "VGCData." You will be able to see when or if the app was recycled. Also, if you do thread dumps during the run, this can cause issues.

Sunday, August 24, 2008

Graphing Java Garbage Collection part 1 - using IBM's Memory Visualizer

Graphing Garbage Collection (GC) has always been tough. Since you need to see each entry, SiteScope is useless do to its periodic collection method. In fact, there are very few tools which will analyze it and even fewer which will graph it out. For the past few years, myself as well as many others have come up with custom tools to do this parsing and report generation. However, it is difficult to find the time to maintain the scripts. When the transition to WebSphere 6.1 broke all our automation ... again, it was time to look around again to see if there was another tool.

It had been awhile since I had looked at IBM's tool. I think the initial version (it might have even been a different tool) only parsed IBM's JVM and didn't parse Sun's (IBM's version of Java on Solaris is just Sun's with an additional library vs. a totally different version for Z/OS). A few years and versions later I remember having to load a library depending on what version of WebSphere I had (this could have also been a different tool). This was again cumbersome and since my automation worked well, I didn't pay much attention to it.

Now we have IBM's ISA version 4 and MV version 2. The tool is still quirky (after all it is written in Java), but it is by far the best (only?) tool I've seen that can parse and graph GC data for Sun's JVM. Hopefully this post will help navigate you through its quirkiness so you can overlook its obvious design faults.


If you've never analyzed GC Data before:
  • Make sure the JVM has the following arguments set: -XX:+PrintGCTimeStamp -XX:+PrintGCDetails. This prints out a timestamp for each GC based off of when the server was started (yeah, I know this is weird, but there is no option to do system time) and the details of the three generations of memory

  • Download the nativestdout.log from your app server. This is where all the data from the settings will be dumped out to.


  1. First Install IBM's ISA Tool and the accompanying Add-on for the Memory Visualizer.

  2. Open up ISA:

  3. Click: Analyze Problem

  4. Click browse, Select "Remote Artifact Browse" and find the log file. (More quirkiness. It may take several minutes - not exaggerating - for you to navigate to your folder so make sure it isn't too deep or copy the path into the textbox which might not work.)

  5. Now you can begin analyzing the log - see next post!

Thursday, August 21, 2008

Installing IBM Support Assistant and performance tools

  1. Download and install IBM's ISA framework
  2. Open up ISA and go to Update > "Find New.." > Tools Add-ons


  3. Select "IBM Monitoring and Diagnostic Tools for Java - Garbage Collection and Memory Visualizer" and "IBM Thread and Monitor Dump Analyzer for Java (Tech Preview)." Click Next through the remaining screens. It will ask you to restart itself.